How to Read ECG Heart Monitor? What’s the Heart Attack Curve Like?
- viatomtechnology
- Jun 9, 2021
- 7 min read
Updated: Mar 17
You must be familiar with ECG, as it is one of the most common medical tests for initial diagnosis. The results obtained from the ECG heart monitor are in the form of curves. Understanding them is a bit tricky. With the help of these curves, different diseases such as heart attack (Myocardial infarction), hypertension, and other heart diseases can be diagnosed.
Suppose you don’t know how to read a 12 lead ECG machine. Stay with us as this article will guide you through the ECG heart monitor reading and help you maintain your health.

What does an ECG show? How to read ECG?
Before going into detail, let me introduce ECG. Short for Electrocardiogram, ECG is a diagnostic tool used to access the electrical and muscular function of the heart. According to American Heart Association, ECG is used to measure the rhythm and heartbeat rate of the heart by placing electrodes on the skin. Moreover, with the help of an ECG, evidence of blood flow to the heart can be measured. Around ten electrodes are required to produce 12 electrical views of the heart (An electrode is placed on each leg and arm, and six electrodes are placed on the chest). The signal from all electrodes is measured, and a curve is plotted. The printed results from the test are knowns as 12 lead Electrocardiogram.
Even though ECG is a comparatively simple test, interpreting the results and graphs requires some technicalities, but it can be learned. Making it one of your routine check-ups, ECG can help you improve your health.
Where do you put leads for 12 lead ECG Interpretation?
In a 12 lead ECG, 10 electrodes are used to generate 12 distinct views of the heart's activity, offering unique perspectives through every two electrical planes.


What is a normal ECG? How to interpret an ECG 12 lead?
1. ECG Paper Explained
On the ECG graph, Voltage is shown on the vertical or Y axis, and it is measured in millivolts (mV), and one the x-axis Time is plotted. A deflection of 10mm on a standard ECG paper represents a voltage of 1 mV. The standard paper moves 250mm in one second. The variation in the electric signal is shown in the form of waves.

2. Heart Rhythm
Sinus rhythm refers to the heart's normal electrical activity, originating in the SA node and propagating through the AV node, bundle of His, bundle branches, and Purkinje fibers. This process creates three distinct ECG waves representing atrial and ventricular depolarization and repolarization[1].
The three types of waves, namely P wave (when atria are contracting), QRS Complex (When ventricles contract), and T wave (When ventricles relax). The P wave is followed by a short delay known as the atrioventricular (AV) node, which shows electrical depolarization. This node is shown in the form of a straight horizontal line on ECG paper, called PR interval.
There should be a pattern of these waves, and any irregularity is a sign of any health issue. I.e., if P waves in the graph are absent, it is an indication of Atrial fibrillation.

3. Heart Rate
Heart rate can be calculated by counting the number of large squares between QRS on the ECG curve and dividing 300 by the number. For example, the rate between beats 1 and 2 in the picture below is 300/4.4 (68 beats/min). P wave on a curve is used to determine whether a person is in sinus rhythm or not.

4. Cardiac Axis
The cardiac axis reflects the overall direction of electrical activity during ventricular depolarization, which is the sum of depolarization vectors produced by individual heart muscle cells. In clinical practice, the ventricular axis is the primary focus, and its interpretation depends on analyzing the relationship between the QRS complex axis and the limb leads on the ECG. As the left ventricle is larger and more muscular, the normal axis lies to the left.

Normal Axis: QRS axis between -30° and +90°
Left Axis Deviation: QRS axis less than -30°
Right Axis Deviation: QRS axis greater than +90°
Extreme Axis Deviation: QRS axis between -90° and 180°
How to identify heart attack through interpreting 12 lead ECG?
Normal ECG obtained from ECG heart monitor looks like a smooth curve. The distance between each spike is almost constant. Each spike represents one whole heartbeat, the distance between spikes represents your heart rate. What exact diseases can be detected by 12 lead ECG interpretation? Below are the four most common heart conditions that affect people. Discover their features in 12 lead ECGs.
A normal ECG curve from 12 electrodes:

Tachycardia & Bradycardia
If there are irregular gaps and clusters of spikes, there might be a problem with your heart (It might be associated with a heart attack). If the spikes are too close together, the person shows signs of Rapid heartbeat/ tachycardia, which may lead to palpitations, dizziness, or shortness of breath. To check for tachycardia on the ECG, find whether the heart rate is over 100 bpm at rest and QRS complexes wider than 120 milliseconds with no visible P waves.
In contrast, bradycardia (slow heart rate) is a condition where the heart beats abnormally slowly, causing fatigue, fainting, weakness, etc., showing a heart rate under 60 bpm in ECG.
A normal heart has the following readings:
Normal heart rate: 60-100bpm
Tachycardia: > 100 bpm
Bradycardia: <60bpm

Atrial Fibrillation (AFib)
Atrial fibrillation (AFib) is a common irregular heartbeat characterized by chaotic contractions of the heart's upper chambers, leading to a rapid atrial rate of 400 to 600 beats per minute. The hallmark of atrial fibrillation is a rapid, pounding heartbeat, shortness of breath, or feeling lightheaded[2]. If untreated, it can increase the risk of stroke or heart failure.
Patients with AFib will not have discernible P waves, and one may see a narrow complex rhythm with an "irregularly irregular" pattern and possibly small, irregular fibrillatory waves (f-waves).

Ventricular Fibrillation (VFib)
Ventricular fibrillation (VFib) is a life-threatening rhythm where the heart's lower chambers beat rapidly and erratically, preventing effective blood pumping. Immediate treatment is critical[3].
If you see a wavy line without clear P waves, QRS complexes, or T waves, consider the possibility of ventricular fibrillation. Also, mind that the rate may be very fast, up to 600 bpm.

What disease needs long-term regular ECG monitoring?
The following is the list of some of the common disease which needs long term regular ECG monitoring:
High blood pressure
Chest pain
Shortness of breath
Heavy heartbeat
Enlargement of Heart
Abnormal rhythm
Principle of 12 lead ECG test?
The principle behind the working of an ECG heart monitor is: Like other muscles, Cardio muscles or heart muscles contract in response to any electric depolarization of the muscle cells. It is the simulation of any muscle that alters the electric potential of a muscle fiber.
What is an ECG machine?
From bulky to wearable: ECG machine evolution
What is an ECG machine? ECG heart monitor is used to track the heart rhythm by recording the signals from electric electrodes, and it plots them on paper. The machine will store the reading that can be accessed by the doctor to diagnose any disease. The term ECG or Electrocardiogram was coined by Einthoven in 1893. Willem Einthoven is considered the founder of the ECG machine, and in 1924 he was awarded the prestigious Nobel prize in Physiology. In 1901, he invented a new string galvanometer with a very high sensitivity used in electrocardiography. The weight of the machine was 600 pounds. The machine was made available for clinical use. Many improvements were made to the machine; thus, today, the machine is in the most refined form.

While effective, these traditional ECG machines are often bulky and require clinical settings for operation, limiting their accessibility for continuous or at-home monitoring. Modern advancements have led to the development of portable ECG machines, which combine convenience with accuracy and enable continuous, real-time ECG tracking outside clinical settings with flexible 1/3/5/7/12 lead options. Viatom presents you with its latest ECG heart monitor weighing only 18g. Yes, you heard that right——

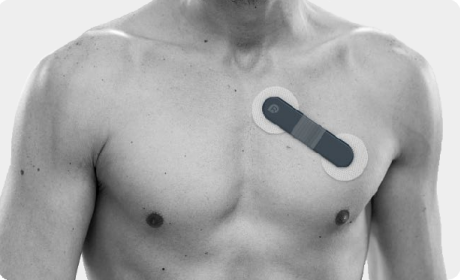


Innovative Viatom ECG recorder with AI analysis
Once there was a time when the ECG recorder was 600 pounds, Viatom’s 18g wearable ECG monitor has made heart monitoring more convenient, accurate, and accessible. It is one of the best ECG heart monitors that you can get on the market. The machine can be used to conduct ECG at home. It has a battery run time of 72 hours, and it offers an expected service life of 5 years. With the help of Viatom’s ECG heart monitor, you can get ECG readings faster, accurately, and more comprehensively.
Moreover, Viatom’s portable ECG machine features an innovative AI ECG Analysis Tracker with rich statistical analysis, including analysis of atrial flutter and fibrillation, heart rate oscillation analysis for early intervention in high-risk patients, P wave superposition analysis for accurate P wave detection in noisy signals, and ST-segment analysis to monitor elevation or depression, crucial for detecting myocardial ischemia or infarction in suspected coronary artery disease cases. Furthermore, the AI ECG Tracker supports flexible template editing, particularly useful for tracking patients with chronic conditions. And the heart rate variability (HRV) analysis assesses autonomic function, allowing clinicians to predict arrhythmias or sudden cardiac events.

Viatom is also advancing its capabilities in innovative medical service solutions to support a variety of healthcare scenarios, such as effective remote ECG diagnosis, benefiting hospitals, clinics, health centers, and individuals.
About Viatom
Viatom is a leading medical equipment manufacturing and distribution company, and we are especially known for our OEM (Original Equipment Manufacturer) services. Viatom helps original equipment manufacturers create reliable equipment, providing customers with consistent performance and lasting value. We are a leading global provider of OEM solutions in home medical devices. We have been deeply involved in different medical fields for many years, and we continue to innovate and develop mobile medical equipment. With years of experience, we believe that we can devise the most creative solution for you. Our wearable ECG devices are trusted by doctors and patients from all corners of the world.
References:
[1] Cardiology Teaching Package - The University of Nottingham
[2] Atrial Fibrillation - StatPearls Publishing (2023)
[3] Ventricular Fibrillation - Cleveland Clinic (2024)